Invest with confidence.
Deep analysis. Powerful tools. Actionable insights. Stay ahead of the market — one ticker at a time.

Growth, interrogated
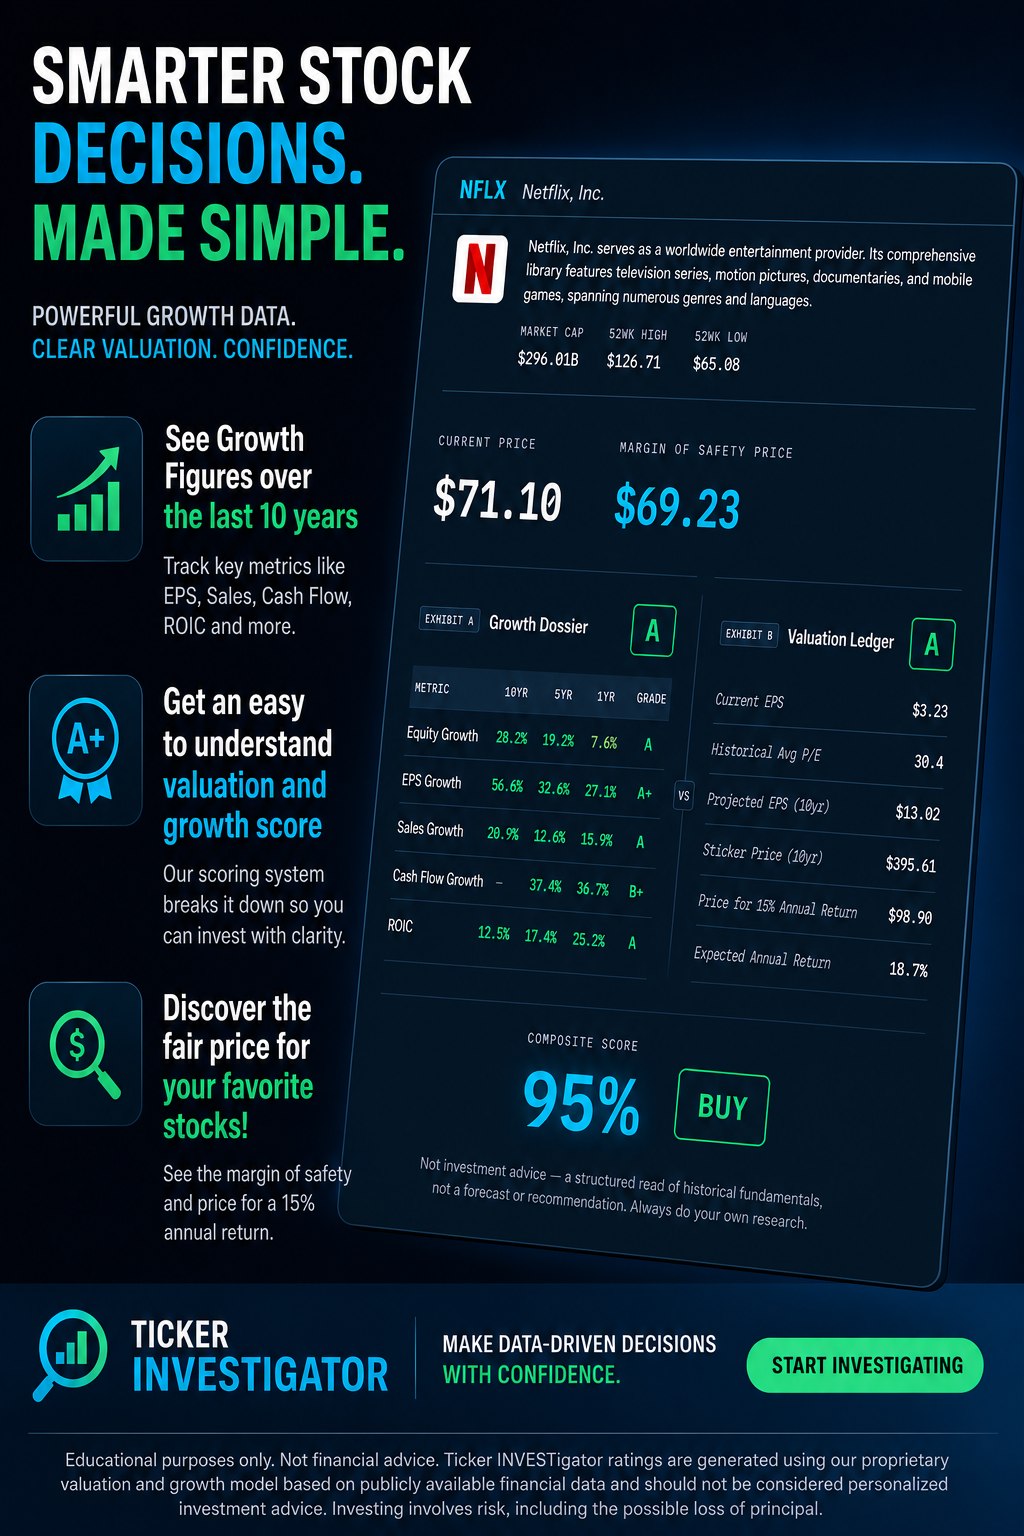
Five fundamentals — Equity, EPS, Revenue, Cash Flow, and ROIC — each graded on their 10, 5, and 1-year growth, then blended into one Growth Grade.
Valuation, cross-examined
A sticker price, a margin-of-safety price, and an expected annual return — so you know not just if a business is good, but if it's a good price.
A verdict, stamped
Every ticker gets a Composite Score and a clear Strong Buy to Strong Sell signal — no spreadsheet required.
Earnings This Week
Trending Large Cap Stocks
Highest Volume
Biggest Movers
Trending Small Cap Stocks
Highest Volume
Biggest Movers
Economic Indicators
Market News
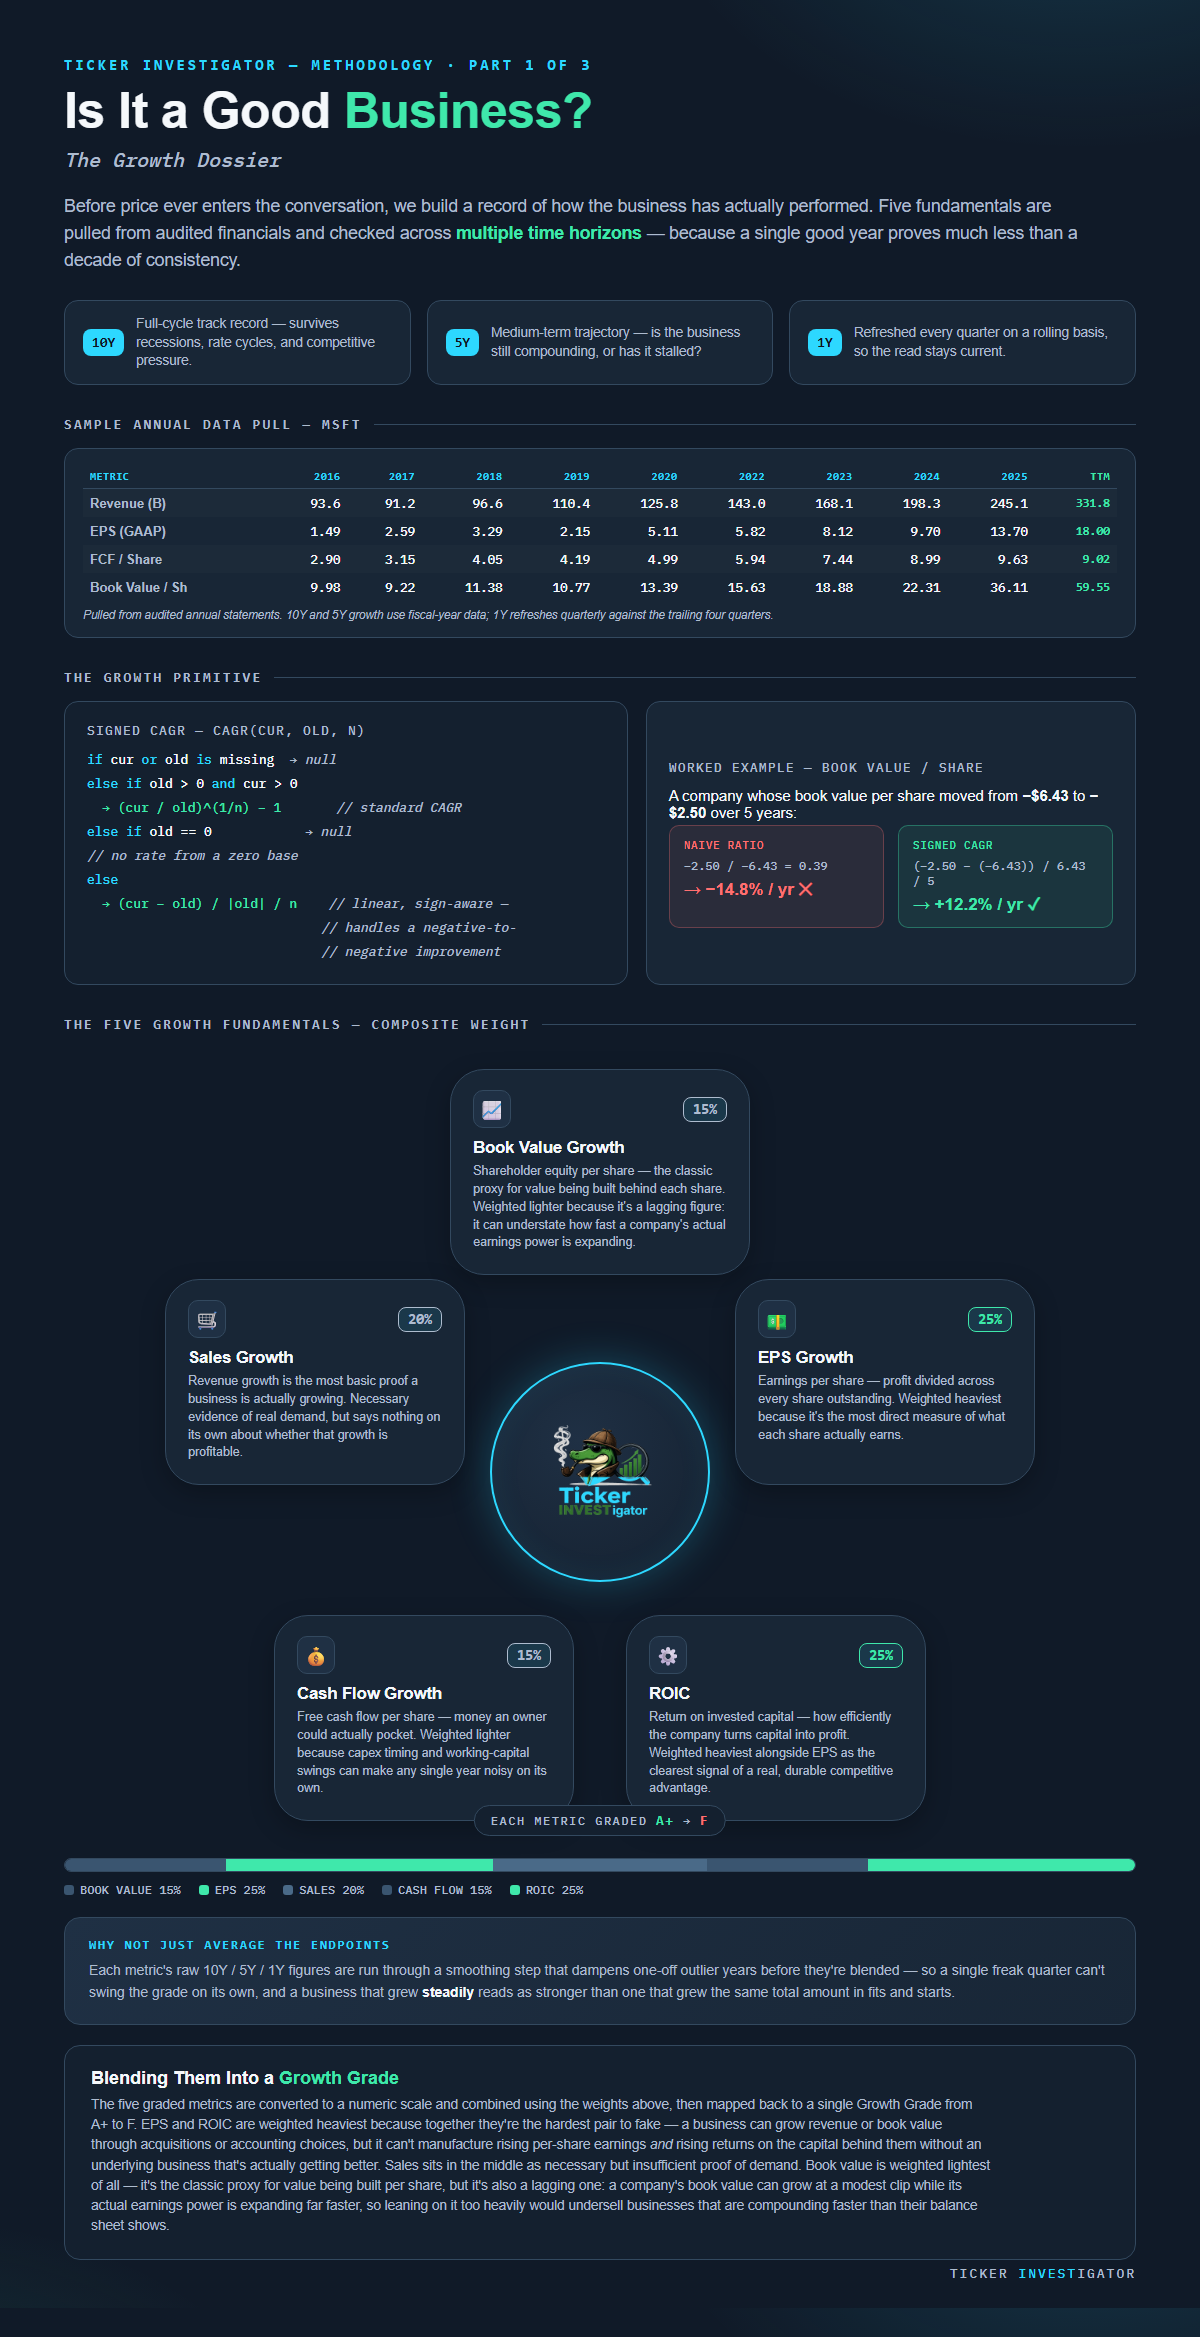
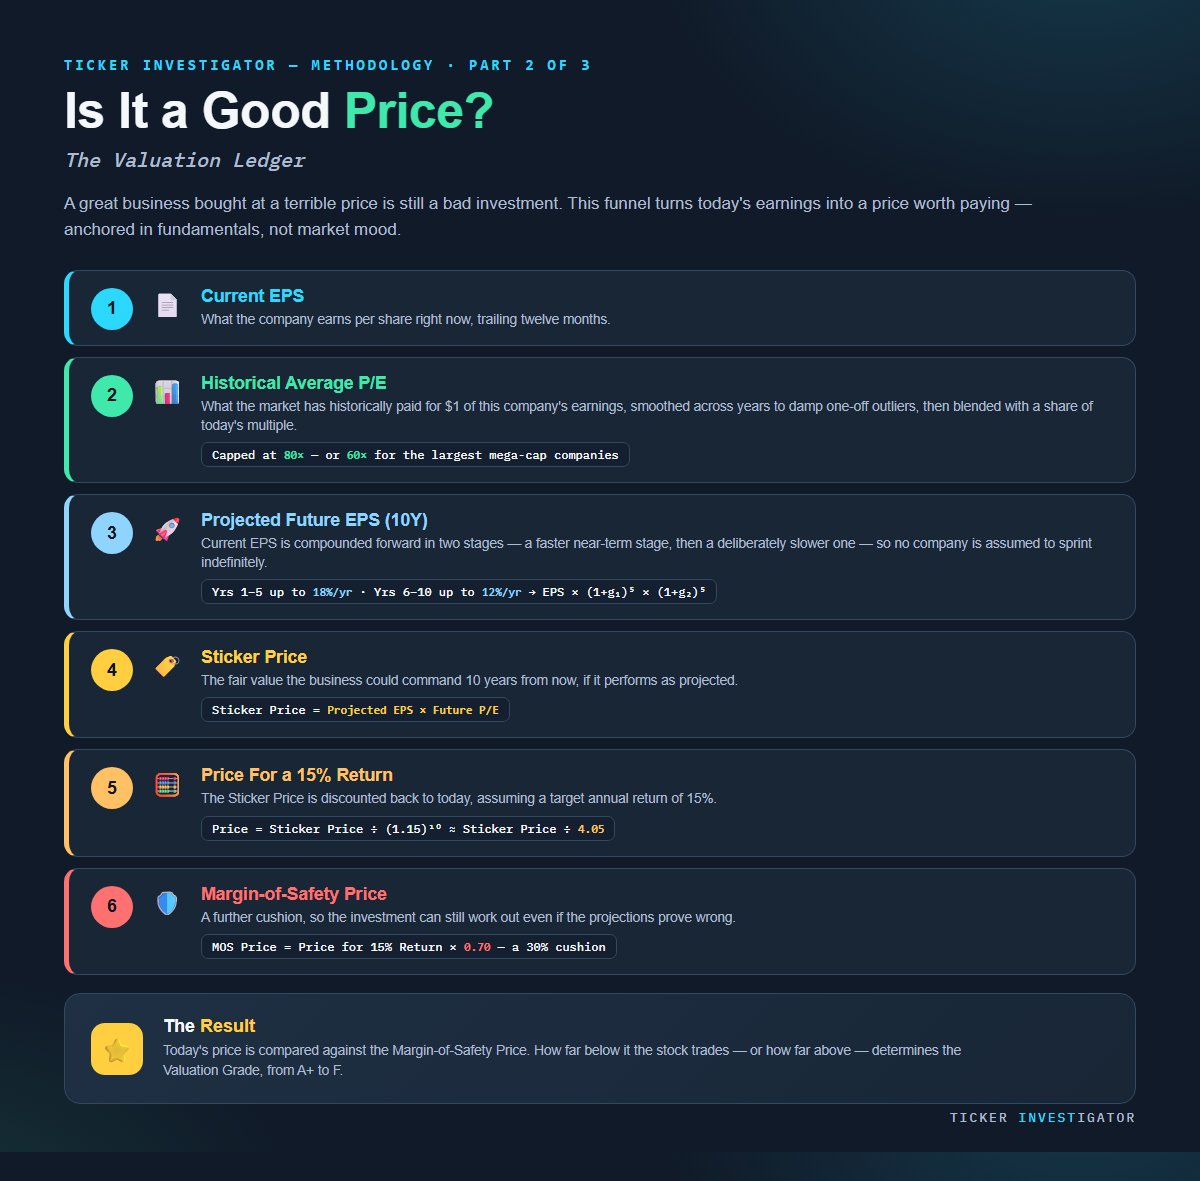
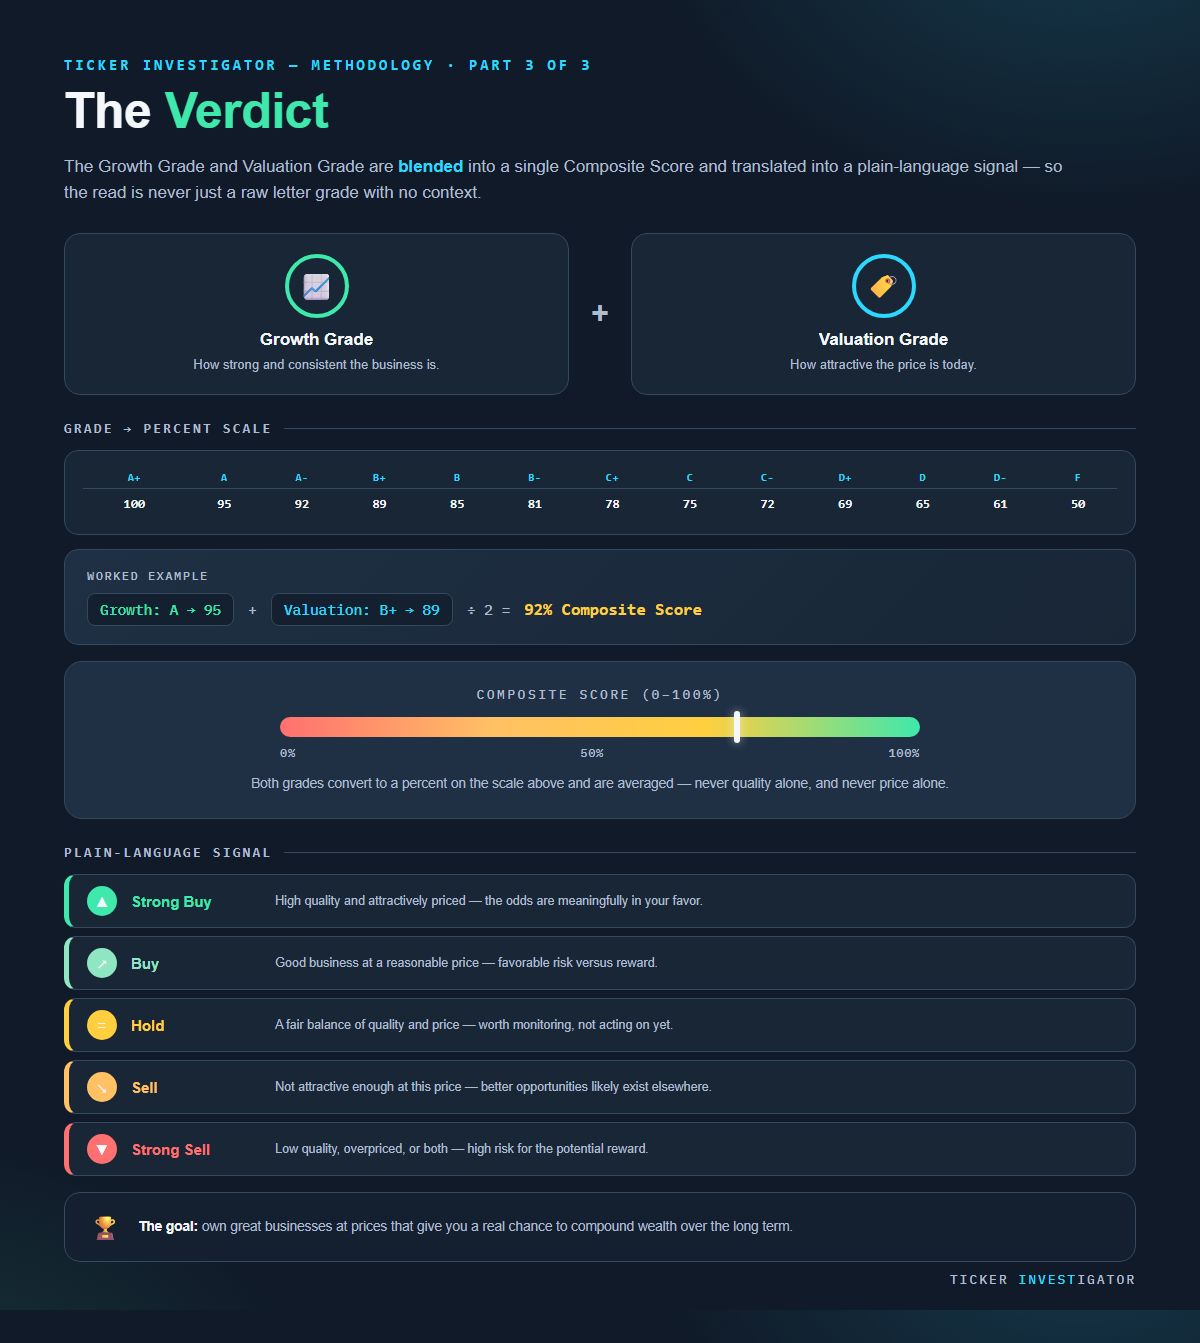
These grades and the verdict are a structured way to read historical fundamentals — not a forecast, and not personalized advice. Always do your own research before investing.


This is an ADR — information may be inaccurate and outdated.
📊 This is an ETF — growth and valuation grades don't apply the way they do to a single company, since a diversified fund can't be evaluated as one business. Its price, dividend, and portfolio data still work normally everywhere else.
Exhibit A Growth Dossier
| Metric | 10yr | 5yr | 1yr | Grade |
|---|
Exhibit B Valuation Ledger
- Current EPS
- —
- Historical Avg P/E
- —
- Future P/E (used for sticker price)
- —
- Projected EPS (10yr)
- —
- Sticker Price (10yr)
- —
- Price for 15% Annual Return
- —
- Expected Annual Return
- —

Not investment advice — a structured read of historical fundamentals, not a forecast or recommendation. Always do your own research.
Quarter Results
Each figure is for that single quarter, compared to the quarter right before it — not the same quarter a year ago.
Exhibit C Raw Data (last 10 years)
This is the exact underlying data used to compute the growth rates and grades above — check the math yourself against any year. The highlighted TTM column is the trailing twelve months through the most recently reported quarter, so a report from a few days ago shows up immediately rather than waiting for the next fiscal year-end.
Ticker INVESTigator Price Target
A one-year expectation, not a buy price — what we would pay is the Margin of Safety figure in the Valuation Ledger above.
Previous targets
Analyst Data
Price Target
Where the stock trades today vs. the range of 12-month price targets from covering analysts.
Exhibit D Related Coverage
Paraphrased summary — not the full transcript.
Field Notes AI Summary
Similar Stocks
Case opened —. Findings are derived from historical fundamentals — not a forecast, not advice. Cross-examine before you invest.
Reports you've filed here for later reference. Each one is a frozen snapshot — the grades and numbers stay exactly as they were the day you filed it, even if the ticker's live report changes afterward. Up to 10 at a time.
Log in or start your free trial to track your portfolio.
Your Portfolio - your current holdings
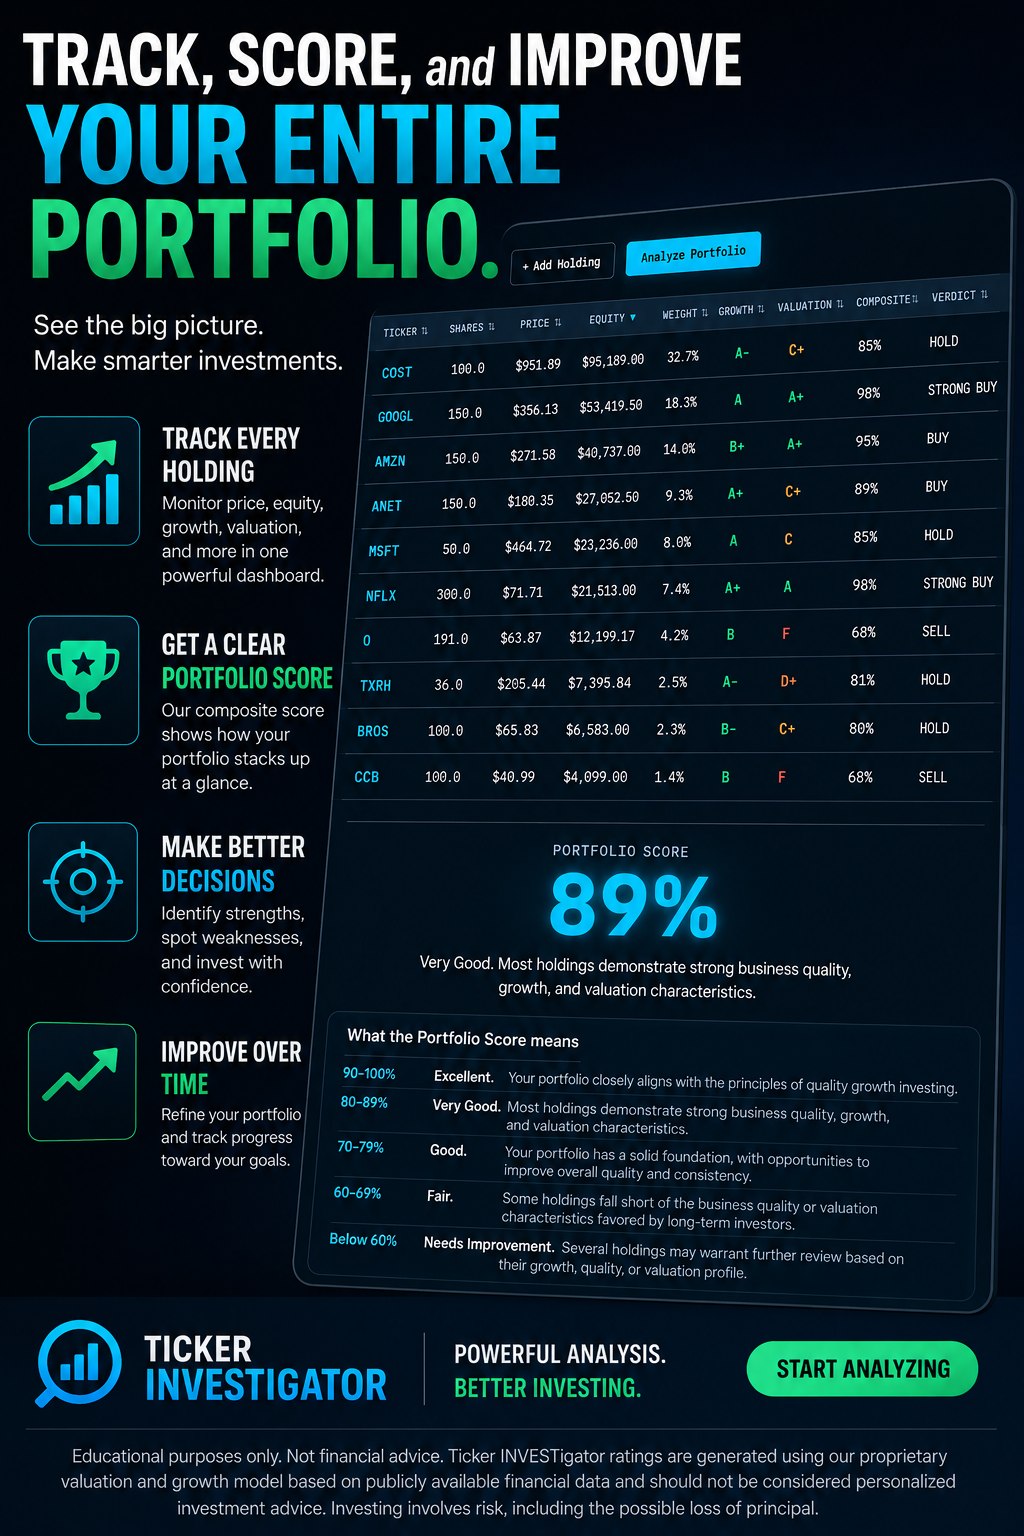
Enter up to 20 holdings — ticker and number of shares — and get a Growth Grade, Valuation Grade, and Composite Score for each, plus one equity-weighted Portfolio Score. Position value is calculated automatically from the current share price.
Saved to your account — accessible from any device you log in on.
| Ticker | # Shares |
|---|
| Ticker ⇅ | Shares ⇅ | Price ⇅ | Equity ⇅ | Weight ⇅ | Growth ⇅ | Valuation ⇅ | Composite ⇅ | Verdict ⇅ |
|---|
What the Portfolio Score means
These are the holdings entered on the Growth & Valuation tab.
| Ticker | # Shares |
|---|
No holdings entered yet — add some on the Growth & Valuation tab.
| Ticker ⇅ | Shares ⇅ | Price ⇅ | Div/Share ⇅ | Yield ⇅ | Annual Dividend ⇅ | Safety ⇅ |
|---|
🏆 Portfolio Showdown
Put your real portfolio in a Head to Head vs your friends. Pick a friend, pick a time window (1 day up to 1 year), and optionally back it with a Gator Gold bet. When the window closes, whoever's portfolio posted the better real % return wins. The winner takes the Gator Gold payout for that window (plus the loser's bet, minus a 10% fee, if you both bet) — and the loser still walks away with something. Everybody gets paid; only the amount changes.
Start a Showdown
Betting is optional — leave it at 0 and you still both earn Gator Gold for the Showdown.
If you do set a bet, your friend has to match it before the Showdown can start.
Your Gator Gold is set aside as soon as you send the request, so you need enough to cover it — your balance and savings both count.
The winner takes both bets, minus a 10% fee. If it's a tie, you each get yours back.
Showdown requests waiting for you
Showdown requests you've sent
Active Showdowns
🐊 Gator Gold
This is Ticker INVESTigator's own currency — not real money, and it never converts to any. Earn it by competing in Portfolio Showdown, then invest it and level up your lifestyle to grow your net worth and climb the ranks, from Intern all the way to Wall Street Titan.
🐊 What is Gator Gold?
Gator Gold is the currency of the Ticker INVESTigator universe — shown as a number next to the 🐊 coin icon. It isn't real money, has no cash value, and cannot be converted into anything outside the platform. It exists to measure your investing journey, competitive performance, and consistency. Earn Gator Gold by competing in Portfolio Showdown, testing your real portfolio's performance against friends, and building your reputation. Your lifetime Gator Gold total is permanently displayed on your profile as a badge of experience and achievement.
💰 What can I do with Gator Gold?
You earn Gator Gold by competing in Portfolio Showdown, but you can grow it further by investing it — just like real life. Right here, invest it into stocks, bonds, and a high yield savings account, or spend it leveling up your Domicile and Garage. Stock values are real and live. Growing any of those grows your net worth, which is what moves your rank and title — investing it is the fastest way to climb. Buy companies you believe in like your real portfolio, or try different, crazy investments and new strategies.
👤 Your net worth is public
Your total Gator Gold net worth — liquid balance, plus anything parked in savings, bonds, or stocks — shows on your profile for every other member to see, right alongside a title tier (Intern up to Wall Street Titan) that upgrades automatically the moment you cross the next threshold. Friends can see exactly how you stack up.
🏅 How you're ranked
Every user on the site is ranked #1 to last by total Gator Gold net worth — that's the "Richest Investors" leaderboard below. Rank is recalculated continuously as balances change, so a good week of Showdowns (or a smart stock pick in your Gator portfolio) can move you up immediately.
👑 Become the richest investor
There's no ceiling. Keep challenging friends, keep compounding your savings/bonds/stocks, and keep climbing the title tiers — Intern, Analyst, Associate, Portfolio Manager, Hedge Fund Manager, Chief Investment Officer, Market Legend, and finally Wall Street Titan. Chase the #1 spot on the leaderboard and hold it.
Gator Gold title tiers
 – 79,999 – 149,999 – 249,999 – 499,999 – 999,999 – 2,999,999 – 4,999,999
Liquid Gator Gold available to invest: 0
Stocks
Real, live-tracked tickers — priced with the same data as the rest of the site.
| Ticker ⇅ | Shares ⇅ | Price ⇅ | Avg Cost ⇅ | Equity ⇅ | Return ⇅ | Gain ⇅ |
|---|
No stock positions yet — buy a real ticker above.
High Yield Savings 3% APY
Total 0
Liquid — withdraw anytime. Interest accrues once per day; money added today won't start earning until the following day.
Bonds
Total 0
Locked for a fixed term — 3 months at 4% APY, or 6 months at 5% APY.
Domicile
Tent
Home value: · counts toward net worth
- No perks yet
Buy —
You've reached the top of the Domicile ladder.
Garage
Beater
- No bonus yet
Buy —
You've reached the top of the Garage ladder.
🏆 Richest Investors
Top 10 by Gator Gold net worth — earned playing Portfolio Showdown, not real money.
🥇 Showdown Season
Most Wins
Most Gator Gold Earned
Dividends
A dividend is a portion of a company's profit paid directly to shareholders, usually every quarter, just for owning the stock. It's separate from — and in addition to — any change in the stock's price. For income-focused investors, the goal isn't just growth, it's building a stream of cash payments that grows over time.
Dividend Report
Look up any dividend-paying stock or ETF for a full snapshot: current price and yield, two years of payment history, the dividend safety score with its full reasoning, and the next declared payout.
📅 Upcoming Ex-Dividend Date
The ex-dividend date is the cutoff — you must own the stock before this date to receive the upcoming payout. Buy on or after it, and the dividend goes to the seller instead.
Payout History — Last 2 Years
| Ex-Dividend Date | Amount Paid |
|---|
Dividend Safety Score
Income Calculator
How many shares — and how much invested — would it take to generate a target annual income from dividends alone?
💡 A useful way to think about it: for every $2,000/year in dividend income, you've effectively given yourself a $1/hour raise — based on a standard 2,000-hour work year — without doing any extra work for it.
Try any dividend payer — e.g. KO, JNJ, O. Shown below: $5,000/yr from KO.
👑 Dividend Kings
Companies that have raised their dividend every single year for 50+ consecutive years — through recessions, wars, and market crashes. One of the rarest streaks in business.
🏛️ Dividend Aristocrats
S&P 500 companies with 25+ consecutive years of dividend increases, plus minimum size and liquidity requirements. A larger, slightly less exclusive group than the Kings — every King is eligible to be an Aristocrat, but not every Aristocrat has reached King status yet.
Dividend Safety Score — how it's calculated
Our own methodology (not yet validated the way the Growth/Valuation model is). Starts at 100, then subtracts points:
- FCF Payout Ratio (dividends ÷ free cash flow): over 100% → −45, over 80% → −25, over 60% → −10.
- REITs use a different scale — they're legally required to pay out 90%+ of taxable income, so that's normal, not risky. A REIT only loses points if payout exceeds 115% of cash flow (−30) or 105% (−10). Realty Income (O) at ~90% payout scores as safe, not risky, because of this adjustment.
- Debt/Equity: over 2.5 → −20, over 1.5 → −10, over 1.0 → −5.
- Dividend Kings (50+ year streak) get +5 over Aristocrats-only.
Hover any Safety score in the tables above to see the exact numbers behind that company's grade.
Dividend yield, payout ratios, and safety scores are based on the most recent data available and change over time. This is not a recommendation to buy or sell any security — always do your own research.
Indicators
This is a different lens than the Growth/Valuation engine — no scoring or verdict here, just real chart-based signals: price momentum for a stock you name, plus the same macro indicators from Home, shown as history instead of a single snapshot. Every chart below explains what it is, how it's calculated, and what it means.
Price with 50 & 200-Day Simple Moving Averages
A Simple Moving Average smooths out daily price noise by averaging the closing price over the last N days. The 50-day SMA reacts faster to recent price action; the 200-day SMA reflects the longer-term trend. When the 50-day crosses above the 200-day, traders call it a "golden cross" (often read as bullish); crossing below is a "death cross" (often read as bearish). These are widely-watched support/resistance levels, not guarantees.
RSI — Relative Strength Index
A momentum indicator measuring the speed and magnitude of recent price changes, on a 0–100 scale. Readings above 70 are traditionally considered overbought (the price may have risen too far, too fast); readings below 30 are considered oversold. RSI can stay in extreme territory for a while during a strong trend — it's a signal to weigh, not an automatic buy/sell trigger.
MACD — Moving Average Convergence Divergence
Tracks the relationship between a 12-day and a 26-day exponential moving average of price, plus a signal line that's a 9-day exponential moving average of that MACD line. The MACD line crossing above its own signal line is often read as bullish momentum building; crossing below, as bearish momentum building. The further the lines diverge, the stronger the signal is generally considered to be. Shown over the past month only — the crossovers move too fast to make out at any wider range.
Economic Indicators — History
The same macro signals shown on the Home page, charted over time instead of just today's reading.
Buffett Indicator
Total US stock market value divided by GDP, as a percentage. Warren Buffett has called this "probably the best single measure of where valuations stand at any given moment." Above ~150% has historically been considered a stretched/overvalued market; below 100%, undervalued. It's a long-run gauge, not a short-term timing signal — it can stay elevated for years.
10yr–2yr Treasury Yield Spread
The 10-year Treasury yield minus the 2-year Treasury yield. Normally, longer-term bonds pay more than shorter-term ones. When that flips negative ("inverted"), it has historically preceded most US recessions — though usually with a long and unpredictable lag, sometimes a year or more.
Tobin's Q
The market value of companies' stock divided by the replacement cost of their underlying assets. A ratio above 1 suggests the market is valuing businesses above what it would cost to rebuild them from scratch; the long-run historical average sits well below 1.
Shiller CAPE Ratio
The S&P 500's price divided by the average of the last 10 years of inflation-adjusted earnings, instead of just the most recent year. Smooths out the distortion a single unusually strong or weak earnings year can cause, making it a longer-run valuation gauge than a standard P/E ratio.
Technical indicators describe past price behavior — they don't predict future returns. Economic indicators are long-run valuation gauges, not short-term timing tools. None of this is a recommendation to buy or sell any security.
Company Drag Race
How long for $100 to compound to $1,000?
Two companies, one starting line. This isn't a race on stock price — it's a race on expected return, which depends on both business quality (growth) and the price you're paying for it (valuation). A slower-growing but undervalued company can absolutely beat a faster-growing but overpriced one, because what matters is how fast $100 compounds into $1,000 — not how exciting the story is.
The race models expected annual return, not a guarantee — actual results depend on the business performing the way its historical growth and current valuation imply. Not investment advice.
🤝 Add a Friend by Email
Invite someone by email. Once they accept, you'll be friends — able to race each other's actual saved portfolios (live, based on current holdings and prices, as many times as you want, until either of you ends it), challenge each other to a Portfolio Showdown, and see each other's posts in your Friends feed.
Requests waiting for you
Requests you've sent
Your friends
🔗 Add a Friend by Link
Share your personal link — anyone who opens it becomes friends with you instantly, no email required. Reusable, so send it to as many friends as you want.
Community
Share ideas, suggest site improvements, or just talk shop with other members here. Posts are public to all logged-in members, limited to 250 characters and 5 posts a day per person, and automatically disappear after 24 hours.